Complete Score vs Percentile Analysis | Normalization Explained | Subject-Wise Percentile Table | Good Score Benchmarks | University Cut-off Guide | What Your Marks Mean After the May 21 Exam
The CUET UG 2026 exam crossed a significant milestone on May 21, 2026 — Day 11 of the ongoing exam cycle. With the majority of the most-demanded domain subjects already conducted across multiple shifts between May 11 and May 21, hundreds of thousands of candidates are now asking the same urgent question: what do my CUET marks actually translate to in terms of percentile, and is that percentile good enough for the university and course I am targeting?
This comprehensive guide from cuet-nta.com answers that question with precision. It covers how CUET marks are calculated, what normalization means and how it affects your score, what percentile different raw mark ranges are expected to yield after the May 21 exam and beyond, subject-wise score-to-percentile benchmarks, what counts as a good score for different university tiers, and what candidates should do next while waiting for results in July 2026.
Whether you appeared in one of the May 21 shifts for GAT, Political Science, English, History, Physics, or Sociology — or whether your remaining shifts are yet to come — this guide gives you the clearest available picture of where your CUET 2026 performance is likely to place you.
CUET Marks vs Percentile 2026 — At a Glance
| Parameter | Details |
| Exam Name | CUET UG 2026 (Common University Entrance Test — Undergraduate) |
| Conducting Body | National Testing Agency (NTA) |
| Exam Window | May 11–31, 2026 (CBT mode across 306 centres in India and abroad) |
| Total Registered Candidates | 15,68,866 (one of the largest undergraduate entrance exams in India) |
| Marking Scheme | +5 for correct | –1 for wrong | 0 for unattempted |
| Maximum Marks Per Subject | 250 marks (50 questions × 5 marks each) |
| Score Used for Admission | Percentile score (after normalization) — NOT raw marks |
| Normalization Method | Percentile-based equi-percentile method across multiple sessions |
| Result Expected | First week of July 2026 at cuet.nta.nic.in |
| Score Report Contains | Subject-wise raw marks + Percentile scores for each subject |
| Who Uses Percentile | All participating universities — 250+ institutions across India |
| Good Score (Top Universities) | 700+ marks (combined subjects) for DU, JNU, BHU admission prospects |
| Source | cuet-nta.com — India’s Trusted CUET Preparation Resource |
CUET Marks vs Percentile 2026 — The Key Difference
Before interpreting any score-to-percentile table, it is essential to understand the fundamental difference between CUET marks and CUET percentile — because universities do not use your raw marks for admission decisions. They use your percentile.
| Feature | CUET Marks (Raw Score) | CUET Percentile |
| Definition | Total score calculated using the official marking scheme (+5 correct, –1 wrong, 0 unattempted) | Relative score showing the percentage of candidates who scored equal to or below you in all sessions |
| Range | 0 to 250 per subject | 0.00000 to 100.00000 (calculated to 7 decimal places) |
| Depends On | Your own performance — correct vs incorrect answers | Your performance relative to all other candidates across all shifts |
| Used For | Self-assessment; estimating your performance immediately after the exam | University admissions — all 250+ CUET participating universities |
| Session Specific? | Yes — raw marks reflect your specific shift’s paper difficulty | No — percentile is normalized across all sessions for fair comparison |
| Affected by Normalization? | No — raw marks are exactly what you score | Yes — percentile reflects normalization across multiple exam sessions |
| Example | You scored 185 marks in History | Your 185 marks may translate to 88th percentile after normalization |
| Released When | You can estimate immediately after answer key release | Official percentile released with CUET result in July 2026 |
Key Insight: Many candidates make the mistake of comparing raw marks across different sessions — ‘I scored 190 in History but my friend scored 185, so I did better.’ This comparison is not reliable because both of you may have appeared in shifts of different difficulty levels. The percentile accounts for this — and is the only score that accurately reflects relative performance for admission purposes.
How CUET 2026 Normalization Works — Explained Simply
CUET UG 2026 is conducted across 35 shifts between May 11 and May 31, 2026. Since different shifts have papers of different difficulty levels — some shifts have harder questions, others have easier ones — NTA applies a normalization process to ensure that students appearing in a tougher shift are not unfairly penalized.
Here is how the normalization process works in practice:
Step 1 — Calculate Raw Marks
Your raw marks are calculated using the standard CUET marking scheme: +5 for each correct answer, –1 for each wrong answer, and 0 for each unattempted question. This is your actual subject score.
Formula: Raw Marks = (Number of Correct Answers × 5) − (Number of Wrong Answers × 1)
Example: 42 correct answers and 6 wrong answers = (42 × 5) − (6 × 1) = 210 − 6 = 204 marks
Step 2 — Calculate Session Percentile
Within your specific exam session (shift), NTA calculates what percentage of candidates in that same session scored equal to or below your raw marks. This gives your session-level percentile.
Formula: Session Percentile = (Number of candidates in the session with raw score ≤ your score ÷ Total candidates in that session) × 100
Step 3 — Apply Equi-Percentile Method Across Sessions
NTA then uses the equi-percentile method to make scores across different sessions comparable. Your session percentile is mapped to an equivalent normalized score that accounts for the varying difficulty of different shifts. This normalized score is what appears on your CUET scorecard and what universities use for merit list preparation.
Step 4 — Calculate to Seven Decimal Places
To prevent ties and the ‘bunching effect’ — where many candidates share the same percentile — CUET percentile scores are calculated to seven decimal places. This means percentile scores like 98.3456789 are common on CUET scorecards, and even tiny differences between candidates are captured precisely.
Important: In CUET 2026, the normalization method applies specifically to subjects conducted across multiple sessions. For subjects conducted in a single session only, percentile equals the session performance directly. The equi-percentile method ensures that a candidate who appeared in a tougher shift and scored 170 marks may receive the same or higher normalized score than a candidate from an easier shift who scored 185 — because the difficulty difference is accounted for.
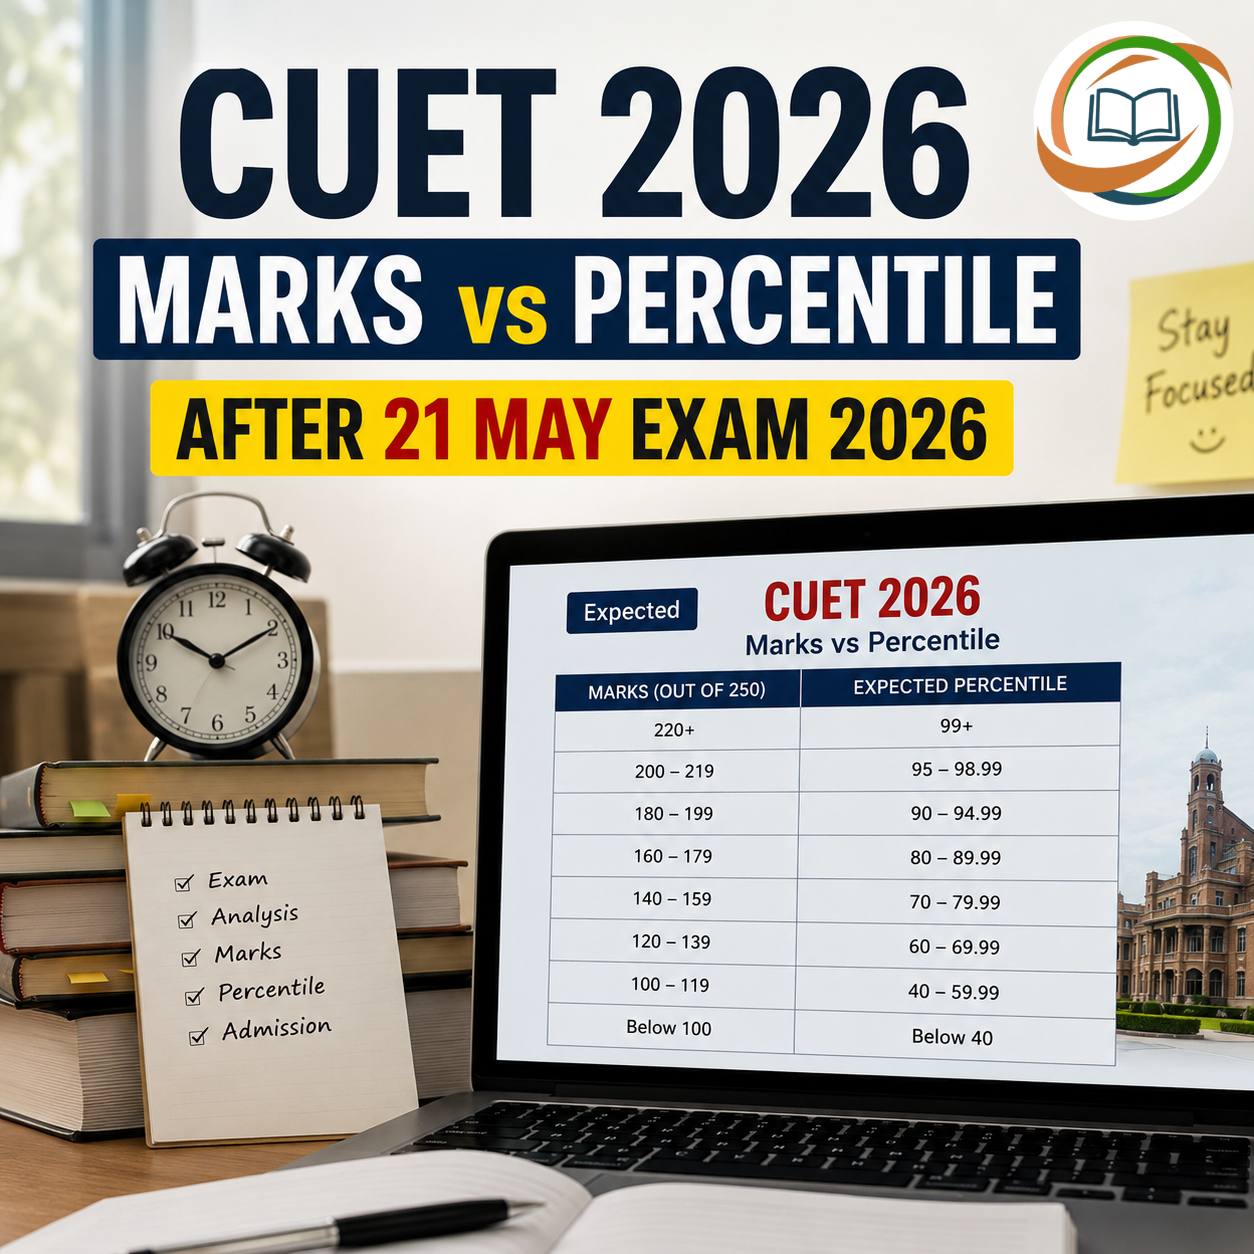
CUET Marks vs Percentile 2026 — Expected Score-to-Percentile Mapping
The following tables provide expected score-to-percentile mappings for CUET UG 2026, based on analysis of historical CUET data from 2022 to 2025 and factoring in the observed difficulty trends from the May 11–21, 2026 exam window. These are directional estimates — actual percentiles will be confirmed with official results in July 2026.
Overall Combined Score (Multi-Subject) vs Percentile
| Combined Raw Marks (Multiple Subjects) | Expected Percentile | Admission Prospects | University Tier |
| 1100+ marks | 99th+ percentile | Extremely strong — top DU colleges, JNU flagship programmes | Tier 1 — Most competitive |
| 1000–1099 marks | 98th–99th percentile | Very strong — DU, JNU, BHU top programmes | Tier 1 |
| 900–999 marks | 95th–98th percentile | Strong — all central universities, top state universities | Tier 1–2 |
| 800–899 marks | 90th–95th percentile | Good — central universities, DU north campus colleges | Tier 2 |
| 700–799 marks | 82nd–90th percentile | Competitive — Allahabad University, JMI, Pondicherry, Hyderabad | Tier 2–3 |
| 600–699 marks | 70th–82nd percentile | Moderate — state central universities, private universities | Tier 3 |
| 500–599 marks | 55th–70th percentile | Limited options — state/private universities primarily | Tier 3–4 |
| Below 500 marks | Below 55th percentile | Restricted — mostly private universities and small colleges | Tier 4 |
Single Subject Score vs Percentile (Per Subject, 250 Marks Max)
| Raw Marks (Per Subject) | Expected Percentile | Performance Level | DU/JNU Prospects |
| 235–250 marks | 99th–100th percentile | Exceptional — top 1% of all candidates in that subject | Excellent — top college admission very likely |
| 220–234 marks | 97th–99th percentile | Outstanding — top 3% nationally | Very strong — most DU colleges achievable |
| 210–219 marks | 95th–97th percentile | Excellent — top 5% nationally | Strong — mid-tier DU colleges achievable |
| 195–209 marks | 90th–95th percentile | Very Good — top 10% nationally | Good — BHU, JNU, Allahabad University prospects |
| 180–194 marks | 83rd–90th percentile | Good — top 17% nationally | Moderate — state central universities achievable |
| 165–179 marks | 75th–83rd percentile | Above Average — top 25% nationally | Limited for top tier; good for state universities |
| 150–164 marks | 65th–75th percentile | Average — competitive mid-tier admission | State universities and private colleges |
| 130–149 marks | 50th–65th percentile | Below Average — limited central university options | Primarily private and affiliated colleges |
| Below 130 marks | Below 50th percentile | Needs improvement | Private universities; explore other options |
Note: All percentile estimates above are directional projections based on CUET 2022–2025 historical data and the moderate difficulty observed in the May 11–21, 2026 exam window. Actual percentiles depend on total candidate performance across all shifts and will be officially confirmed with the CUET UG 2026 result in July 2026 at cuet.nta.nic.in.
CUET 2026 — Subject-Wise Marks vs Percentile (After May 21 Exam)
Different subjects have different competition levels in CUET 2026 based on the number of candidates attempting them and the average difficulty of papers. The following subject-wise tables provide expected marks-to-percentile benchmarks based on observed 2026 paper trends and historical data:
English (Language Paper)
| Raw Marks | Expected Percentile | Assessment |
| 220–235 | 99th+ percentile | Exceptional — top DU English colleges achievable |
| 205–219 | 96th–99th percentile | Outstanding performance |
| 190–204 | 90th–96th percentile | Very strong — competitive for all central universities |
| 175–189 | 82nd–90th percentile | Good — state central universities well within reach |
| 160–174 | 72nd–82nd percentile | Above average — moderate admission prospects |
| 145–159 | 58th–72nd percentile | Average — limited central university options |
| Below 145 | Below 58th percentile | Below average — primarily private institutions |
History
| Raw Marks | Expected Percentile | Assessment |
| 220–250 | 98th–100th percentile | Exceptional — top 2% nationally |
| 200–219 | 93rd–98th percentile | Outstanding — DU History (Hons) achievable |
| 185–199 | 85th–93rd percentile | Very strong — BHU, JNU competitive range |
| 170–184 | 75th–85th percentile | Good — Allahabad, Hyderabad University range |
| 155–169 | 62nd–75th percentile | Above average — state central universities |
| Below 155 | Below 62nd percentile | Limited — state and private universities |
Political Science
| Raw Marks | Expected Percentile | Assessment |
| 220–250 | 98th–100th percentile | Exceptional — top DU colleges (Miranda House, Hindu College) |
| 205–219 | 94th–98th percentile | Outstanding — most DU Political Science programmes |
| 185–204 | 86th–94th percentile | Very strong — BHU, JNU range |
| 170–184 | 76th–86th percentile | Good — Allahabad, Pondicherry competitive |
| 150–169 | 60th–76th percentile | Above average — state universities |
| Below 150 | Below 60th percentile | Limited options — private institutions primarily |
General Aptitude Test (GAT)
| Raw Marks | Expected Percentile | Assessment |
| 205–250 | 97th–100th percentile | Exceptional — GAT is highly competitive with lakhs of takers |
| 185–204 | 90th–97th percentile | Outstanding — strong GAT score for all universities |
| 165–184 | 80th–90th percentile | Very strong — comfortable range for most central universities |
| 145–164 | 68th–80th percentile | Good — adequate for many participating universities |
| 125–144 | 54th–68th percentile | Average — limited central university options |
| Below 125 | Below 54th percentile | Below average — reassess target universities |
Mathematics
| Raw Marks | Expected Percentile | Assessment |
| 215–250 | 97th–100th percentile | Exceptional — Maths is highly competitive (engineering aspirants) |
| 190–214 | 90th–97th percentile | Outstanding — very strong for B.Sc. Maths at top universities |
| 165–189 | 78th–90th percentile | Strong — competitive for BHU, Allahabad, state central universities |
| 140–164 | 62nd–78th percentile | Good — state universities and private colleges |
| 115–139 | 45th–62nd percentile | Average — limited central university options |
| Below 115 | Below 45th percentile | Below average — private institutions primarily |
Physics & Chemistry
| Raw Marks | Expected Percentile | Assessment |
| 210–250 | 96th–100th percentile | Exceptional — top B.Sc. programmes at DU, BHU, JNU achievable |
| 185–209 | 88th–96th percentile | Very strong — competitive for all science central universities |
| 160–184 | 76th–88th percentile | Good — BHU, Allahabad, Hyderabad University range |
| 135–159 | 60th–76th percentile | Above average — state universities well within reach |
| Below 135 | Below 60th percentile | Average to below average — private college options primarily |
CUET May 21, 2026 — What Happened and Why It Matters for Your Percentile
May 21, 2026 was a significant exam day in the CUET UG 2026 cycle. The following subjects were conducted across Shift 1 and Shift 2: GAT (General Aptitude Test), Political Science, English, History, Physics, and Sociology. Based on student and expert analysis of the May 21 exam:
| Subject (May 21) | Overall Difficulty | Key Observation | Percentile Impact |
| GAT (General Aptitude Test) | Moderate to Tough | Quants-dominant: 40 out of 50 questions from Quantitative Aptitude — unexpectedly high QA weightage | Higher difficulty means normalization may lift scores from this shift upward |
| Political Science | Easy | Match the Following, one-word MCQs, case studies — highly accessible for NCERT-prepared students | Easy paper = more competition at high marks; top scores needed for elite percentile |
| English | Moderate to Difficult | 3–4 RC passages making it time-consuming; grammar and vocabulary questions included | Moderate difficulty means fair distribution of marks across candidates |
| History | Easy | Completely NCERT-based; no map questions; very manageable for prepared students | Easy History = high good attempt range; top percentile requires 210+ marks |
| Physics | Moderate | Direct formula-based and conceptual questions; manageable for NCERT-prepared Science students | Moderate difficulty; normalization expected to balance scores across shifts |
| Sociology | Easy | NCERT-aligned factual questions; rated among the easiest domain papers | Easy paper = higher raw score needed to achieve top percentile |
Percentile Strategy Insight — May 21 Easy Papers: For subjects rated easy on May 21 (Political Science, History, Sociology), the percentile competition is higher because more candidates score in the upper mark ranges. This means that to achieve the same percentile as in a harder shift, a candidate needs to score more raw marks. Normalization levels the playing field — but the key takeaway is: in easy shifts, accuracy matters even more because the margin between good and great percentile is narrower.
What Is a Good Score in CUET 2026 After May 21? — University-Tier Guide
After appearing in the May 21 exam, candidates need a realistic benchmark for what their marks mean in the context of specific university admissions. Here is a tier-wise guide based on historical CUET admission data and 2026 competition levels:
| Score Range (Per Subject) | Percentile Band | Suitable Universities | Programmes |
| 230–250 marks | 99th–100th percentile | DU Top Colleges (Miranda House, Hindu, SRCC, Lady Shri Ram) | BA (Hons), B.Com (Hons) — most competitive programmes |
| 210–229 marks | 96th–99th percentile | DU all colleges, JNU, Jamia Millia Islamia flagship | Hons programmes across Humanities, Commerce, Science |
| 190–209 marks | 88th–96th percentile | BHU, University of Hyderabad, Pondicherry, JNU social sciences | BA/B.Sc. Hons — top state central universities |
| 170–189 marks | 78th–88th percentile | Allahabad University, Jamia, Central University Jharkhand, TISS | Most UG Hons programmes at mid-tier central universities |
| 150–169 marks | 64th–78th percentile | State central universities, Ranchi University, VBU Hazaribagh | BA/B.Sc. General programmes at participating universities |
| 130–149 marks | 50th–64th percentile | State universities, private universities accepting CUET scores | General degree programmes; limited central university options |
| Below 130 marks | Below 50th percentile | Primarily private institutions | UG programmes at affiliated private colleges |
CUET 2026 — Score vs Percentile Analysis: Key Dimensions
| Dimension | 2026 Assessment | Implication for Candidates |
| Total Registered Candidates | 15,68,866 — one of India’s largest UG entrance exams | Higher competition means percentile thresholds are more demanding than smaller exams |
| Normalization Applied | Yes — percentile-based equi-percentile method across 35 shifts | Raw marks alone cannot predict admission outcomes; percentile is the decisive metric |
| Difficulty Trend (May 11–21) | Moderate overall; GAT tough, History/Pol. Sci./Sociology easy | Mixed difficulty means normalization effects vary significantly by subject |
| Score Calculation Precision | Percentile to 7 decimal places — no ties in top ranges | Even 1-mark differences in raw score can translate to meaningful percentile differences at the top |
| Multi-Subject Scoring | Each subject scored and percentiled independently | Strategy: excel in your strongest subjects to maximize individual subject percentiles |
| University Admission Basis | Each university sets its own cutoff using CUET percentile | A single CUET score applies to 250+ universities — maximize subject-wise percentile for best outcomes |
| Result Timeline | First week of July 2026 at cuet.nta.nic.in | 3–6 weeks after exam cycle ends; use this period for university research and form filling |
| Good Score Threshold | 700+ combined marks for top central university prospects | Per-subject target: aim for 185+ per subject for consistent 85th+ percentile performance |
How to Estimate Your CUET Percentile Before Results — Step-by-Step
While official CUET UG 2026 percentiles will only be published with results in July 2026, candidates can make a reasonable estimate of their percentile position using the following approach:
Step 1 — Download the Provisional Answer Key
Once NTA releases the CUET UG 2026 provisional answer key — expected in the first or second week of June 2026 at cuet.nta.nic.in — download it for the subjects you appeared in. Cross-reference the answer key against your response sheet to count correct and incorrect answers per subject.
Step 2 — Calculate Your Raw Marks
Apply the CUET marking scheme: multiply correct answers by 5 and subtract total wrong answers. This gives your raw marks per subject.
Example calculation: If you answered 41 questions correctly and 7 incorrectly in History: Raw marks = (41 × 5) − (7 × 1) = 205 − 7 = 198 marks.
Step 3 — Apply the Score-to-Percentile Benchmarks
Use the subject-wise marks-to-percentile tables in this guide to get a directional estimate of your expected percentile range. Remember that these are projections — the actual percentile depends on how all 15,68,866 candidates performed across all shifts.
Step 4 — Challenge the Answer Key If Needed
If you believe any answer in the provisional key is incorrect, NTA allows candidates to submit objections within a specified window (typically 2–3 days after key release). Valid challenges are reviewed by NTA’s subject experts, and corrections are reflected in the final answer key used for result computation.
Step 5 — Research University-Specific Cut-offs
Once you have an estimated percentile range, research CUET cut-offs from previous years (2022–2025) for your target universities and programmes. This gives you a realistic picture of admission prospects while official results are awaited. Keep in mind that cut-offs may shift upward in 2026 due to higher overall candidate numbers.
After May 21 — What CUET 2026 Candidates Should Do Next
If you have completed all your CUET 2026 exam slots by May 21, or are waiting for results while remaining slots are pending, here is a prioritized action plan:
| Action | Why It Matters | When to Do It |
| Keep your CUET admit card safely | Required for future reference during counselling and admission | Store digital copy immediately |
| Wait for the provisional answer key | Essential for calculating estimated raw marks and checking answers | Expected June 2026 — cuet.nta.nic.in |
| Calculate expected raw marks using answer key | Gives you the clearest pre-result estimate of your marks | As soon as answer key is released |
| Submit answer key challenges if needed | Can improve your raw marks and percentile if NTA accepts corrections | Within 2–3 days of key release |
| Research target universities and programmes | Match your estimated percentile with historical university cut-offs | Now — do not wait for results |
| Fill university-specific application forms | Many universities open separate admission portals after CUET results | July 2026 — watch each university’s official portal |
| Attend university counselling on time | Seat allotment and confirmation requires prompt action | July–August 2026 — date varies by university |
| Do NOT compare raw marks across shifts | Different shifts have different difficulty — only percentile is comparable | Understand this clearly before results |
CUET Marks vs Percentile — Year-on-Year Trend (2022–2026)
Understanding how score-to-percentile relationships have evolved since CUET began in 2022 helps candidates correctly calibrate 2026 expectations:
| Year | Approx. Candidates | Score for 99th Percentile (Per Subject) | Score for 90th Percentile | Key Trend |
| CUET 2022 | 8,00,000+ | 210–220 marks | 175–185 marks | First year of CUET — lower competition, lower cutoffs |
| CUET 2023 | 11,00,000+ | 215–225 marks | 180–190 marks | Second year — rising awareness; cutoffs began climbing |
| CUET 2024 | 13,00,000+ | 220–230 marks | 185–195 marks | Established exam; cutoffs stabilized at higher levels |
| CUET 2025 | 14,00,000+ | 220–235 marks | 185–200 marks | Incremental increase; top university cutoffs tightened |
| CUET 2026 (Projected) | 15,68,866 | 225–240 marks | 190–205 marks | Highest-ever candidates; cutoffs expected 5–10 marks higher |
Key Takeaway: Each year since 2022, the marks required to achieve the same percentile have increased by approximately 5–10 marks per subject. This is because more candidates are appearing and preparation quality is improving nationally. For CUET 2026, candidates should target 10 marks higher than what a given percentile required in 2025 to account for this rising competition trend.
CUET UG 2026 — Important Dates
| Event | Date / Status |
| CUET UG 2026 Exam Window | May 11–31, 2026 (Ongoing — Day 11 completed on May 21) |
| May 21 Subjects Conducted | GAT, Political Science, English, History, Physics, Sociology |
| Remaining Exam Dates | May 22–31, 2026 (check admit card for specific date) |
| Provisional Answer Key Release | First/Second Week of June 2026 (Expected — cuet.nta.nic.in) |
| Answer Key Challenge Window | 2–3 days after provisional key release (as notified by NTA) |
| Final Answer Key | After challenge resolution — June 2026 |
| CUET UG 2026 Result & Scorecard | First Week of July 2026 (Expected) |
| University Application Portals Open | July 2026 — varies by institution |
| University Counselling/Admission | July–August 2026 (Tentative) |
Final Word
CUET marks vs percentile after the May 21 exam carries a clear message for every candidate who has now completed some or all of their CUET 2026 slots: raw marks are only the beginning of the story. The normalized percentile — calculated across 15,68,866 candidates and 35 exam shifts — is the number that determines your admission fate across 250+ universities.
The most productive mindset for the period between May 21 and July 2026 results is focused preparation for what comes next: downloading and checking the answer key carefully when it releases, submitting valid challenges where relevant, researching target universities and their historical cut-offs, and completing university-specific application processes promptly after results. The exam performance is now fixed — what you control is how well-prepared you are for the admission process that follows.
Visit cuet-nta.com for subject-wise CUET answer key analysis, percentile calculators updated after each exam shift, university-wise cut-off trackers for 2022–2026, CUET scorecard interpretation guides, and everything you need to navigate the path from marks to your dream university admission in 2026.
Frequently Asked Questions
CUET marks are the raw score calculated from your correct and incorrect answers using the official marking scheme (+5 correct, –1 wrong). CUET percentile is your relative score showing what percentage of all candidates scored equal to or below you across all exam sessions. Universities use percentile — not raw marks — for admission decisions. A raw score of 185 may translate to an 88th percentile or a 90th percentile depending on how all candidates performed in all shifts — which is why comparing raw marks across sessions is unreliable.
Yes — CUET UG 2026 uses a percentile-based equi-percentile normalization method for subjects conducted across multiple sessions. Since different shifts have question papers of varying difficulty, normalization ensures that candidates who appeared in a harder shift are not penalized compared to those who appeared in an easier shift. The normalized percentile — calculated to seven decimal places — is what appears on your CUET scorecard and is used by universities for merit list preparation.
Based on historical CUET data and 2026 competition levels, achieving a 90th percentile in most domain subjects requires approximately 185–205 raw marks per subject — depending on the specific subject and the overall difficulty of shifts in which it was conducted. For GAT (which is attempted by almost all candidates), the 90th percentile benchmark is slightly higher at approximately 190–210 marks due to the large number of competing candidates. These are directional estimates; official percentiles will be released with CUET results in July 2026.
A good CUET score is context-dependent — it depends on your target university and programme. However, as a general benchmark: 700+ combined marks across attempted subjects is considered a good overall score for central university admission prospects. For Delhi University's most competitive programmes, 230+ per subject in the relevant domain paper and 210+ in English is typically required. For BHU, Allahabad University, and other top state central universities, 185–210 per subject is generally competitive. For 90th+ percentile performance, target 190–210 marks per subject based on 2026 trends.
Not necessarily — and this is where normalization matters. If your May 21 History or Political Science paper was easy, it means other candidates in your shift also found it easy, so more candidates will score in the upper mark ranges. However, NTA's equi-percentile normalization compares your session performance within your session first. If you scored in the top portion of your session — even in an easy paper — your percentile will remain strong. The concern arises only if you scored average in an easy paper, because in that scenario, your session percentile will be lower, which directly affects your normalized score.
Wait for the provisional answer key to be released by NTA (expected June 2026 at cuet.nta.nic.in). Download the answer key and your response sheet. Count your correct answers and wrong answers per subject. Apply the formula: Raw Marks = (Correct Answers × 5) − (Wrong Answers × 1). For example, 40 correct and 8 wrong = (40 × 5) − (8 × 1) = 200 − 8 = 192 marks. Use this raw marks figure with the subject-wise percentile tables in this guide to estimate your expected percentile range.
Delhi University's specific CUET cut-offs vary by college and programme. Based on CUET admission data from 2022–2025, the most competitive DU colleges (Miranda House, Hindu College, Lady Shri Ram College, SRCC) require 98th to 99th+ percentile for Humanities and Commerce Hons programmes. Mid-tier DU colleges typically require 93rd to 98th percentile. For science programmes at DU, 88th to 95th percentile is generally the competitive range. These are historical benchmarks — actual 2026 cut-offs will be released by Delhi University on du.ac.in after CUET results.
The CUET UG 2026 result is expected to be declared in the first week of July 2026 at cuet.nta.nic.in. The result will include subject-wise raw marks and normalized percentile scores for each candidate. Before results, NTA will release the provisional answer key (expected June 2026), followed by a challenge window, and then the final answer key. Candidates can download their official CUET scorecard after results are declared using their application number and date of birth.
Yes — 700+ combined marks across your attempted subjects is generally considered a strong CUET score in 2026, particularly for candidates applying to central universities. A 700+ combined score typically places a candidate in the top 10–18% of all test-takers, depending on the specific subjects and difficulty of the shifts. For Delhi University's most competitive programmes, 700 combined marks may not be sufficient (you would need 230+ per key subject for top DU colleges). However, 700+ is very competitive for BHU, Allahabad University, Hyderabad University, JMI, and many other high-quality participating institutions.
If the May 21 GAT was indeed tougher than other shifts (with approximately 40 out of 50 questions from Quantitative Aptitude), normalization will account for this. A candidate who scored 155 marks in a genuinely tough GAT shift may receive a higher normalized score than a candidate who scored 160 marks in an easier GAT shift — because NTA's equi-percentile method recognizes that the May 21 GAT was harder. This is precisely the purpose of normalization. Candidates who appeared in May 21's tough GAT should not be discouraged by lower raw marks alone.
No Comments yet!